

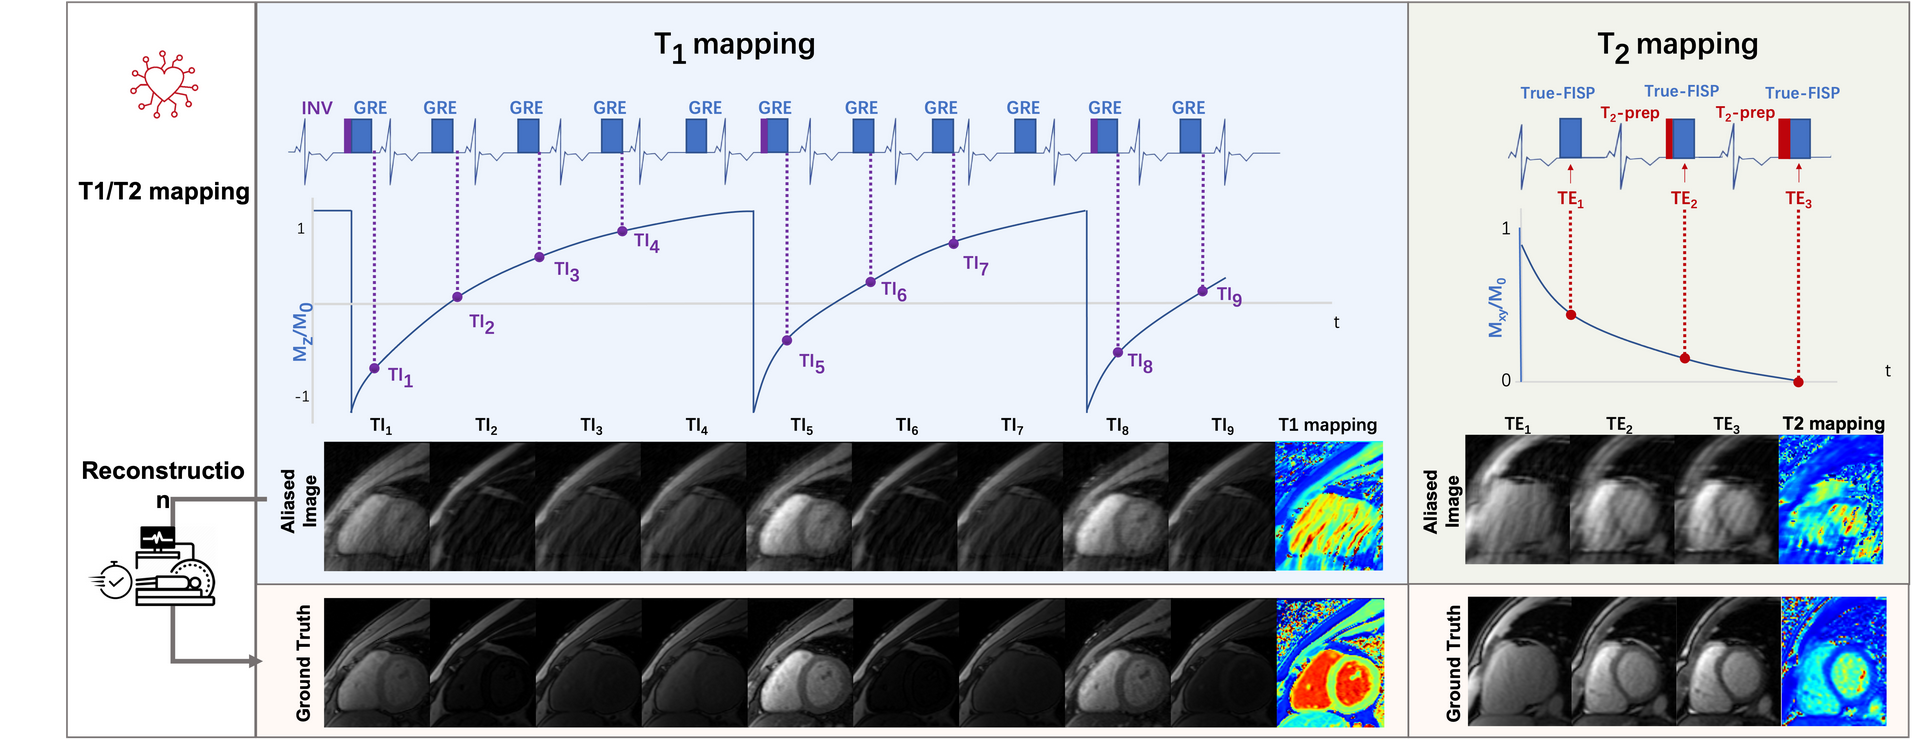
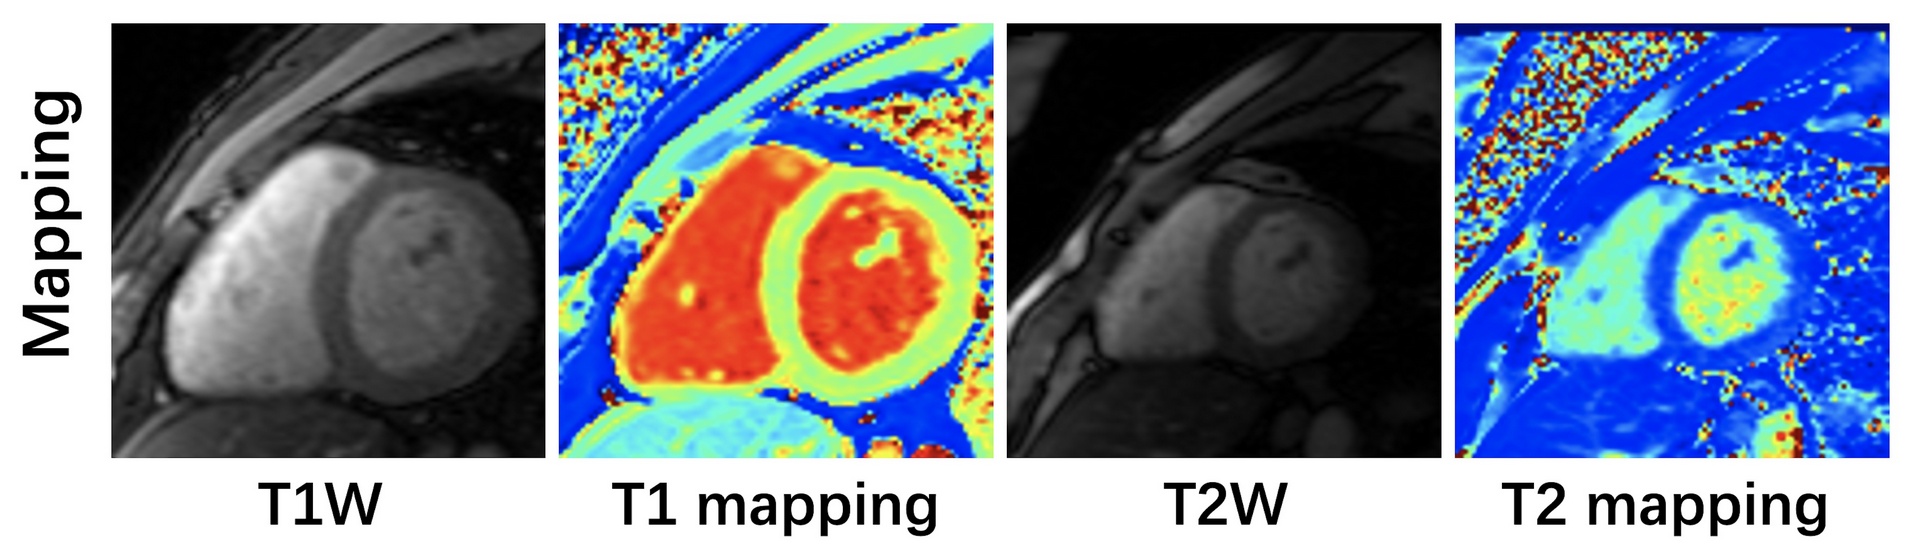
Cardiac T1 and T2 mapping have been widely used for the evaluation of intracellular disturbances of the cardiomyocyte. Characterization of the T1 of myocardial tissue can be used to detect and assess various cardiomyopathies, while T2 changes have been reported in edematous regions in patients with infarction, hemorrhage, graft rejection, or myocarditis. For patients with voluntary breath-holds or cardiac arrhythmia, image degradation will occur during the long acquisition window and motions, thus affecting the image quality. Accelerated T1 and T2 mapping has the capability to shorten the acquisition window, thus those artifacts associated with respiratory motion and arrhythmia can be largely reduced. Conventional T1 and T2 mapping estimation model is prone to fail in the face of highly under-sampled multi-contrast CMR images due to the reduced original image qualities. This challenge aims to establish a platform for multi-contrast CMR reconstruction and provide a benchmark dataset that enables the broad research community to promote advances in this area of research.
Scanner: Siemens 3T MRI scanner (MAGNETOM Vida)
CMR acquisition: We followed the recommendations of CMR imaging reported in the previous publication (doi:
10.1007/s43657-02100018x, 10.1007/s43657-021-00018-x
[w.c.y.1] ). T1 mapping was conducted using a modified look-locker inversion recovery (MOLLI) sequence, which acquired nine images with different T1 weightings (using the 4-(1)-3-(1)-2 scheme). T1 mapping was performed in SA view only with typical FOV of 360×307 mm2, spatial resolution of 1.4×1.4 mm2, slice number of 5-6, slice thickness of 5.0 mm, TR of 2.67 ms, TE of 1.13 ms, partial Fourier of 7/8, and GRAPPA factor of 2.Signals were collected at the end of the diastole with ECG triggering.
A
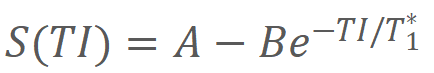
3-parameter fitting model was used to calculate T1 of each signal time course:
where
TI represents the inversion time, and A, B, and T1* were three parameters to be
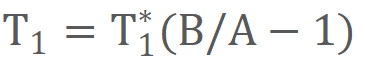
estimated. T1 was determined from the resulting A, B, and T1* by applying the second equation:
T2 mapping was performed using T2-prepared (T2prep)-FLASH sequence with three T2 weightings in SA view, with identical geometrical parameters as used in T1 mapping. Typical imaging parameters were FOV of 360×288 mm2, the spatial resolution of 1.9×1.9 mm2, slice number of 5-6, slice thickness of 5.0 mm, TR of 3.06 ms, TE of 1.29 ms, T2 preparation time of 0/35/55 ms, partial Fourier of 6/8, and GRAPPA factor of 2. Signal data were collected at the end of the diastole with ECG triggering.
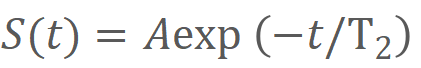
The T2 value is calculated with the equation:
where
S(t) represents the signal intensity, A is the scale factor and t denotes T2
preparation time.
Details of the Data Types of T1 and T2 Mapping
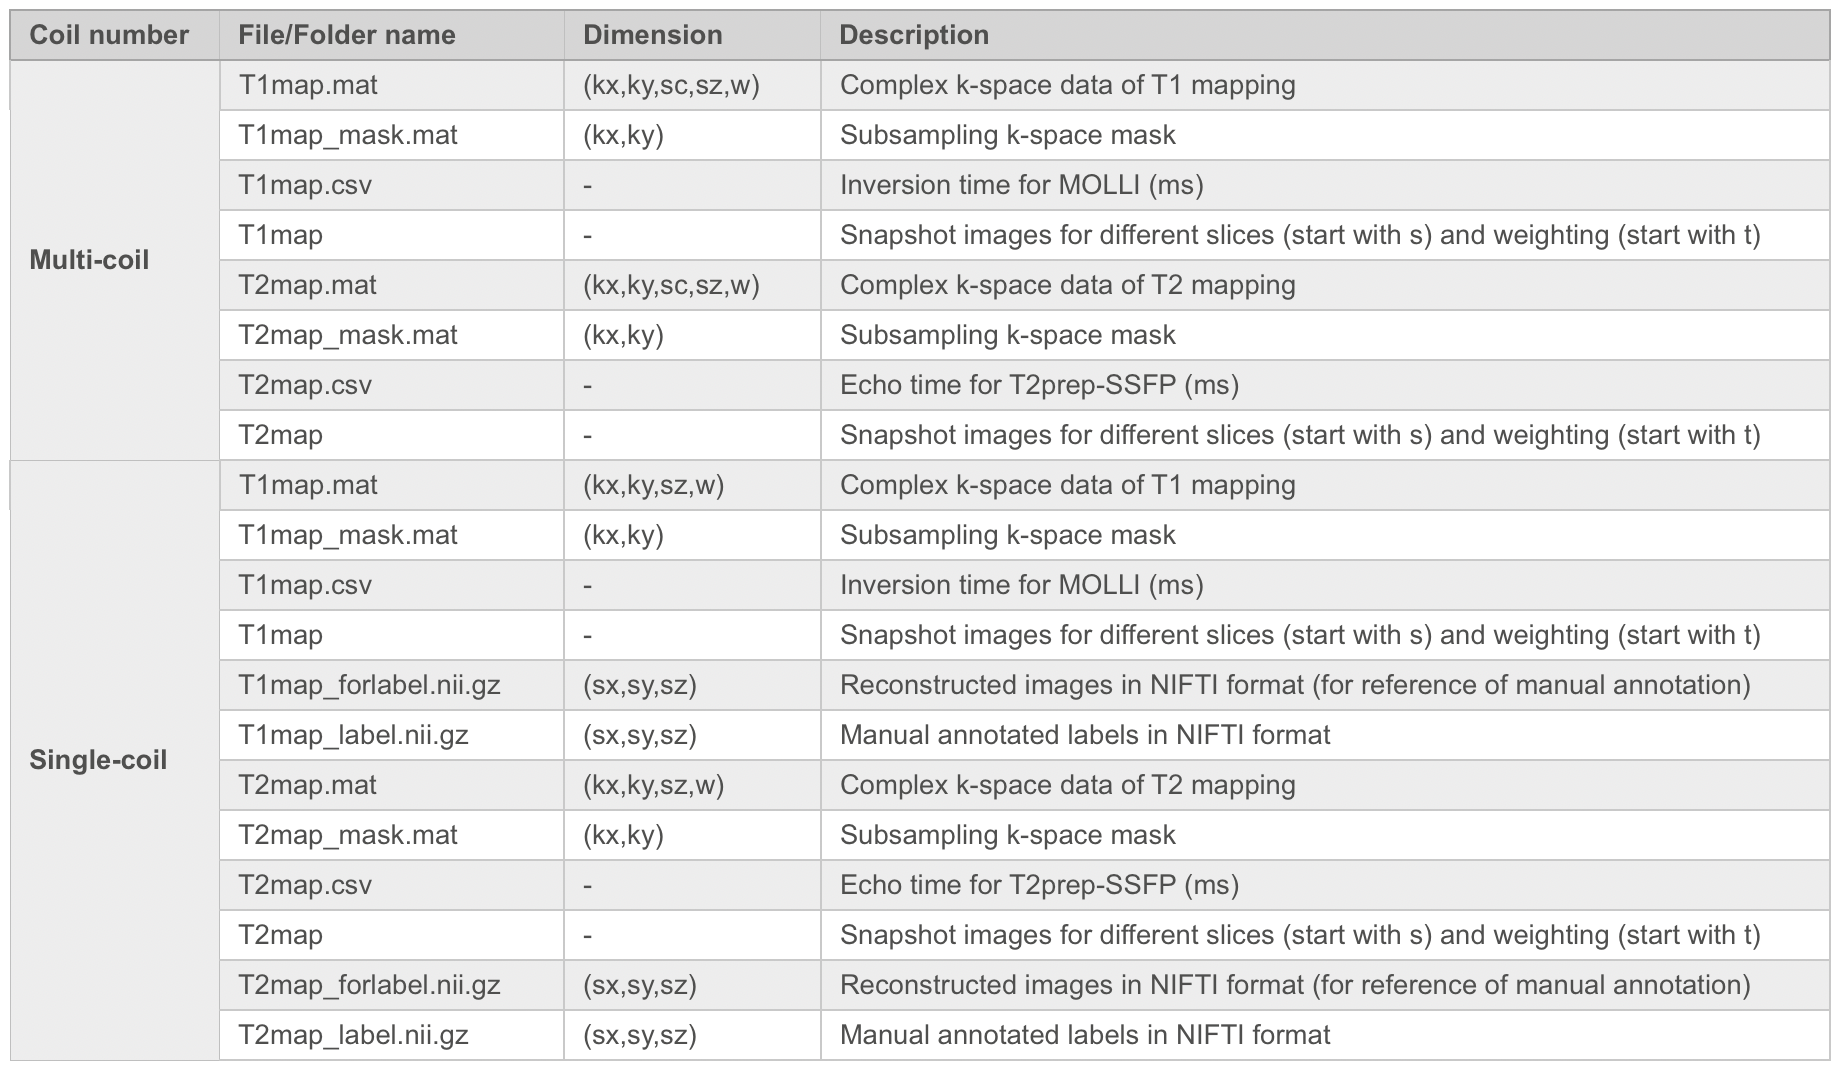
Note: kx: matrix size in x-axis (k-space); ky: matrix size in y-axis (k-space); sc: coil array number (compressed to 10); sx: matrix size in x-axis (image); sy: matrix size in y-axis (image); sz: slice number for short axis view; w: number of weighted images.

Taking T1 mapping as an example, the format of data is as follows:
1. Multi-coil data:
Data: T1map.mat
# mapping with short axis view (including several slices within the sz dimension).
# variable name:
# "kspace_full" for full kspace
# "kspace_sub04" for subsampling factor of 4 along ky
# "kspace_sub08" for subsampling factor of 8 along ky
# "kspace_sub10" for subsampling factor of 10 along ky
# data type: complex kspace data with the dimensions (kx,ky,kc,kz,w), the central 24 lines (ky) are always full sampled to be used as calibration lines
-kx: matrix size in x-axis (kspace)
-ky: matrix size in y-axis (kspace)
-sc: coil array number (compressed to 10)
-sz: slice number (short axis view)
-w: number of weighted images
Data: T1map_mask.mat
# subsampling mask with short axis view, the mask is fixed among different sc, sz and w.
# variable name:
# "mask04" for subsampling factor of 4 along ky
# "mask08" for subsampling factor of 8 along ky
# "mask10" for subsampling factor of 10 along ky
# data type: binary data with the dimensions (kx,ky), the central 24 lines (ky) are always full sampled to be used as calibration lines
-kx: matrix size in x-axis (kspace)
-ky: matrix size in y-axis (kspace)
2. Single-coil data:
Data: T1map.mat
# mapping with short axis view (including several slices within the sz dimension).
# variable name:
# "kspace_single_full" for full kspace
# "kspace_single_sub04" for subsampling factor of 4 along ky
# "kspace_single_sub08" for subsampling factor of 8 along ky
# "kspace_single_sub10" for subsampling factor of 10 along ky
# data type: complex kspace data with the dimensions (kx,ky,kz,t), the central 24 lines (ky) are always full sampled to be used as calibration lines
-kx: matrix size in x-axis (kspace)
-ky: matrix size in y-axis (kspace)
-sz: slice number (short axis view)
-w: number of weighted images
Data: T1map_mask.mat
# subsampling mask with short axis view, the mask is fixed among different sc, sz and w.
# variable name:
# "mask04" for subsampling factor of 4 along ky
# "mask08" for subsampling factor of 8 along ky
# "mask10" for subsampling factor of 10 along ky
# data type: binary data with the dimensions (kx,ky), the central 24 lines (ky) are always full sampled to be used as calibration lines
-kx: matrix size in x-axis (kspace)
-ky: matrix size in y-axis (kspace)
Data: T1map_forlabel.nii.gz
# reconstructed images in nifti format (for reference of manual annotation)
-sx: matrix size in x-axis
-sy: matrix size in y-axis
-sz: slice number (short axis view)
Data: T1map_label.nii.gz
# manual annotated labels in nifti format
# label 1 for left ventricle
# label 2 for myocardium
# label 3 for right ventricle
-sx: matrix size in x-axis
-sy: matrix size in y-axis
-sz: slice number (short axis view)
The submission instructions will be released on the Synapse platform.
created with
Website Builder Software .